Concept project
WordPress Speed Optimization: A Load Simulator
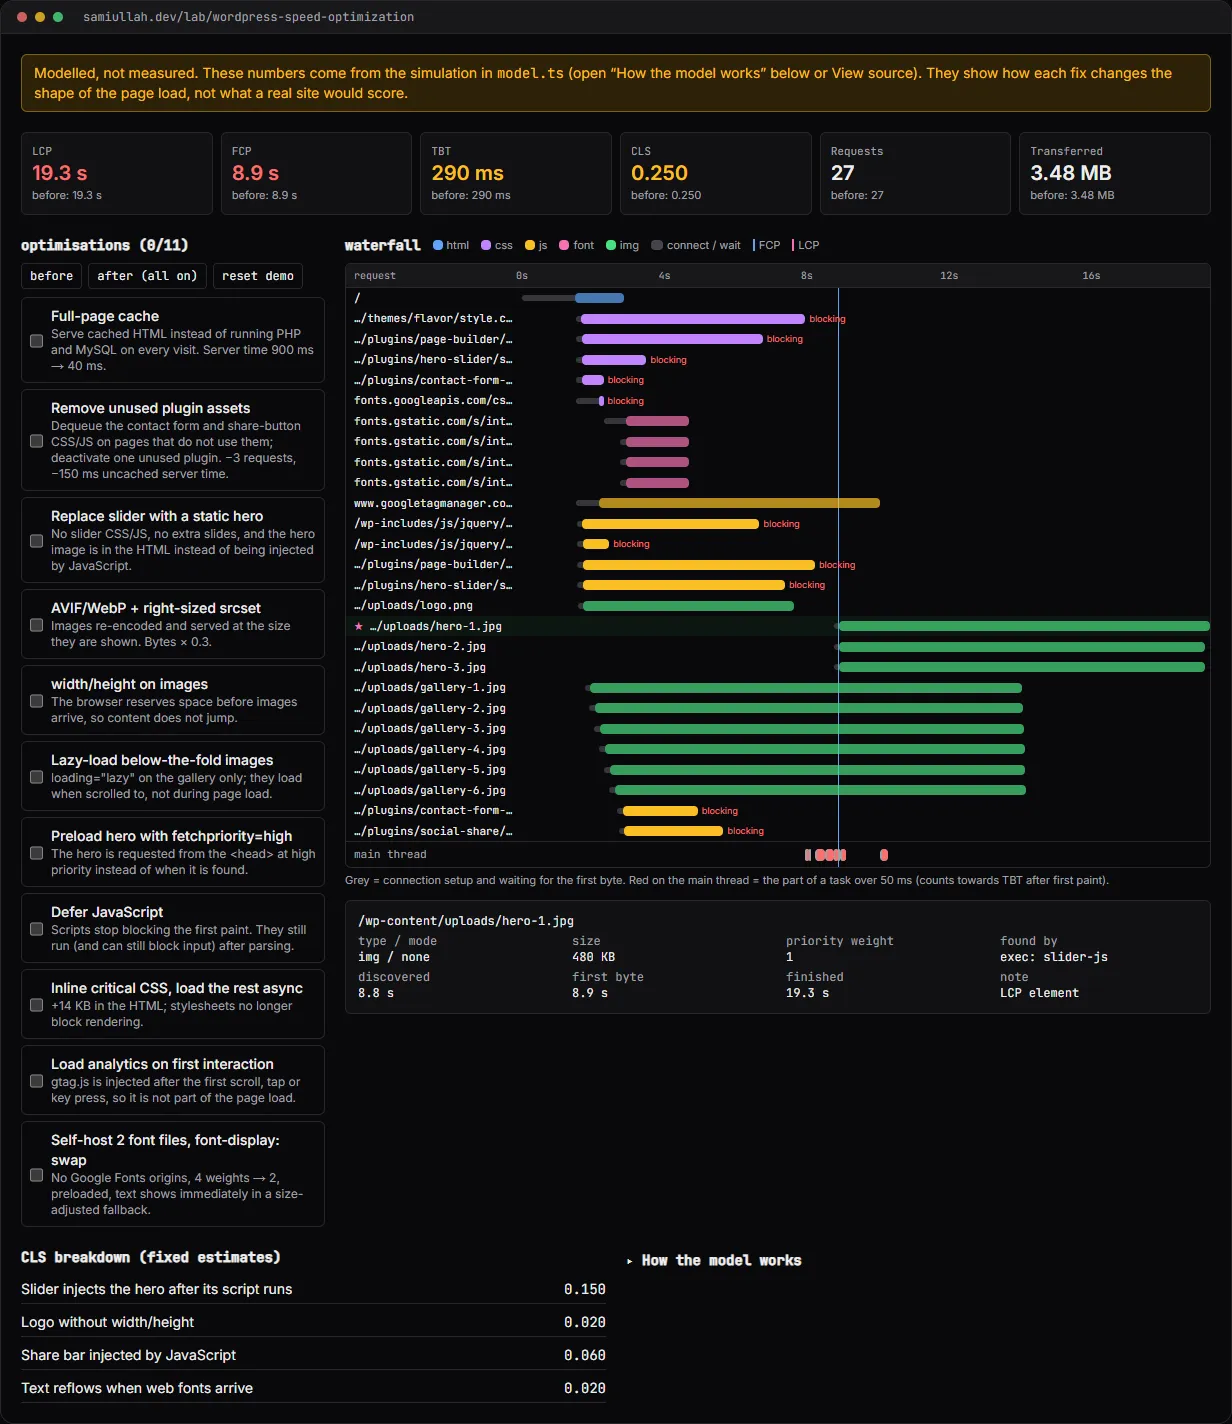
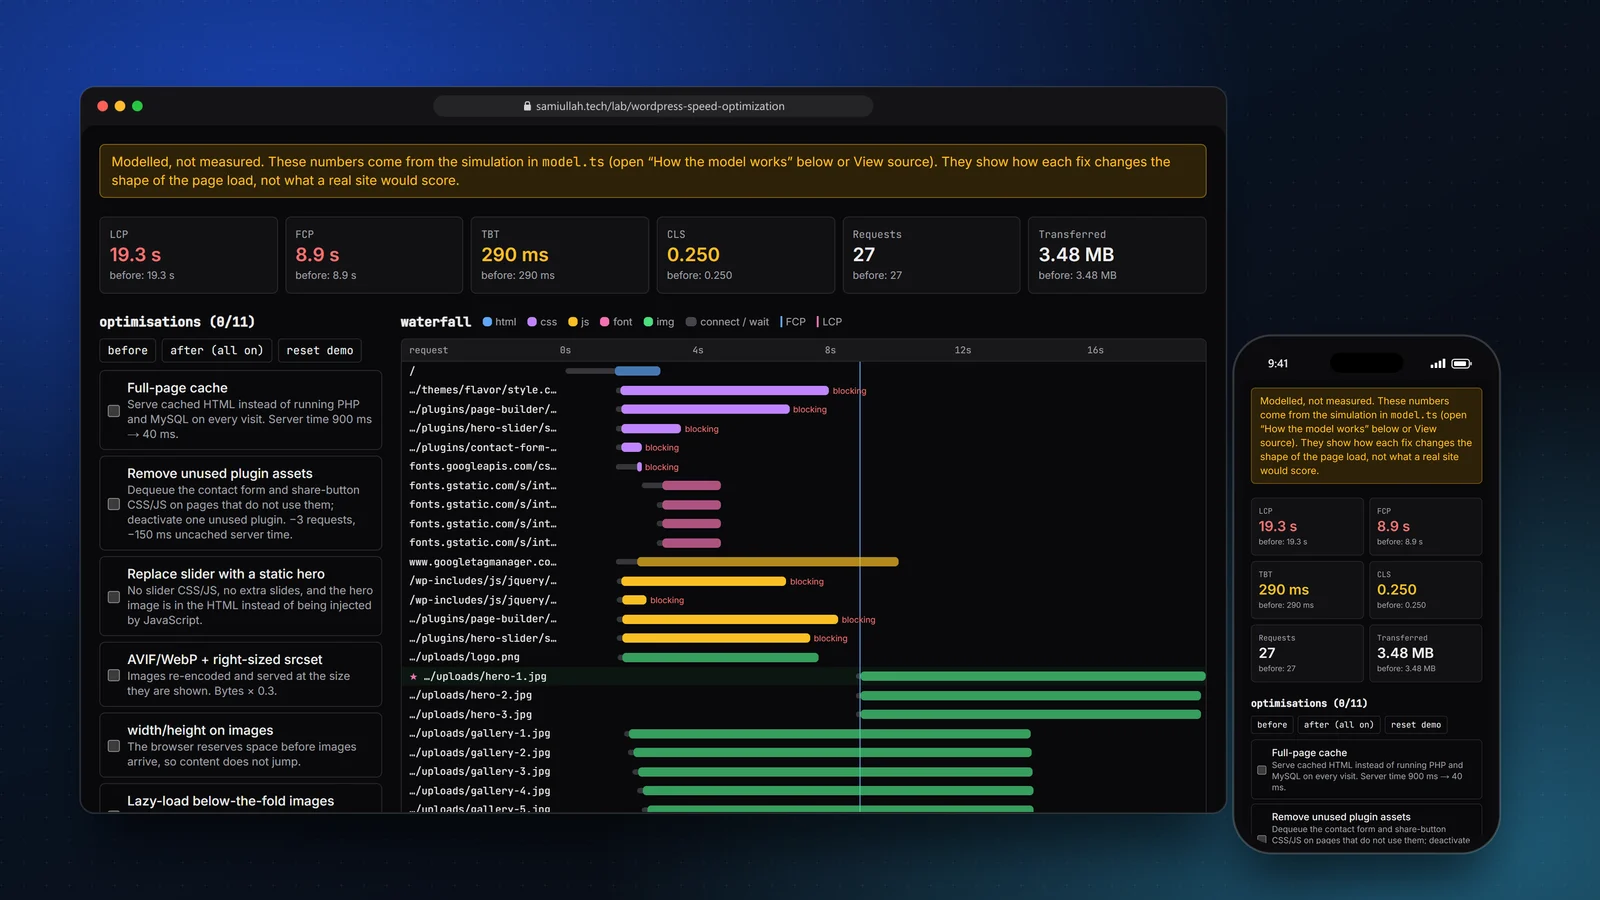
A concept project with a working demo: an interactive page-load simulator for a typical slow WordPress home page. Each fix (page cache, modern images, lazy loading, deferred scripts, critical CSS, self-hosted fonts, fewer plugins) changes a modelled waterfall and Core Web Vitals estimates. The model is my own and fully visible; nothing here is a client measurement.
Overview#
Speed work is easy to claim and hard to show without client data. I did not want to put "LCP from 6 s to 1.2 s" on a page with nothing behind it. So this concept does something different: it explains why each common WordPress speed fix works, with a simulator you can poke.
The live demo models a typical slow home page: a multipurpose theme with a page builder, a hero slider, Google Fonts, analytics and a few plugins loading assets everywhere. You switch fixes on and off and watch the request waterfall, the main thread and the estimated metrics change.
The numbers are modelled, and the page says so above the metrics. The rules of the model are on the page and in the source.
My role#
Everything: the page-load model, the demo, the PHP must-use plugin that applies the fixes on a real site, and this write-up. It is a concept project; no client site was measured.
The problem#
When a WordPress site is slow, the usual advice is a list: "add caching, compress images, defer JavaScript". Owners install a plugin that does all of it and the score moves, or does not, without anyone knowing why. Two things are missing:
- Cause and effect. Which fix moves which metric, and why? Deferring JavaScript helps first paint but can raise Total Blocking Time. Lazy loading helps, unless it is applied to the hero image.
- Honesty about numbers. Before-and-after scores without the reports behind them are not evidence.
Approach & architecture#
- Togglesthen
- buildResources()then
- simulate() in 5 ms stepsthen
- metrics()then
- waterfall + LCP / FCP / TBT / CLS
Requests as data. buildResources() turns the toggles into the page's requests. Each one records its size, origin, priority and how the browser finds it. That last field matters most: the slider's hero image is only found after slider.js downloads and runs, which is why sliders are so bad for LCP.
const heroDiscover: Resource["discover"] = o.preloadHero
  ? { by: "html", pos: 0 }           // <link rel="preload" fetchpriority="high"> in <head>
  : o.replaceSlider
    ? { by: "html", pos: 0.15 }       // a plain <img> in the markup
    : { by: "exec", id: "slider-js" }; // injected by the slider after it runs
A small network and CPU simulation. simulate() uses Lighthouse's mobile throttling values (150 ms round trips, about 1.6 Mbps, 4× CPU slowdown). New origins cost three round trips. Bandwidth is shared by priority, so HTML, blocking CSS and fonts get more than images. One main thread runs HTML parsing and scripts in the order a browser would: synchronous scripts wait for earlier stylesheets, deferred scripts run after parsing, async scripts run when they arrive.
Metrics from the timeline. First paint waits for parsing, blocking CSS, head scripts and, without font-display: swap, up to 3 seconds for web fonts. LCP is when the hero image arrives. TBT adds up the part of each task over 50 ms after first paint. CLS uses fixed estimates per cause, listed in the demo, because modelling layout properly would be a different project.
The fixes in PHP. In the production design the changes live in a must-use plugin, not in a settings screen:
add_action( 'wp_enqueue_scripts', 'acme_speed_dequeue', 100 );
function acme_speed_dequeue(): void {
	if ( ! is_singular() || ! has_shortcode( (string) get_post_field( 'post_content' ), 'contact-form-7' ) ) {
		wp_dequeue_style( 'contact-form-7' );
		wp_dequeue_script( 'contact-form-7' );
	}
	if ( ! is_singular( 'post' ) ) {
		wp_dequeue_script( 'social-share' );
	}
}
The same file adds the defer loading strategy with wp_script_add_data, preloads the hero through the wp_preload_resources filter, keeps it out of lazy loading, inlines critical CSS and loads the rest with media="print".
Key challenges#
- Keeping the model honest. The model is simple on purpose, so every number can be traced to a rule. It leaves out repeat-visit caching, image decoding and layout cost; the demo lists these.
- Order matters. In the model, turning on "defer JavaScript" alone moves first paint earlier but raises TBT, because the same work now runs after the first paint. Deferred scripts still have to run, so the same effect shows up on real pages, and it is the reason the demo shows the main thread.
- Discovery, not just bytes. Shrinking images helps, but the biggest LCP gains in the model come from letting the browser find the hero image early: replacing the slider and preloading the hero.
- Readable on a phone. The waterfall is a CSS grid with percentage positions, so it scales with the container and scrolls sideways inside its box on narrow screens.
Tech stack#
- Demo: TypeScript, React and Next.js.
model.tsholds the request list, the simulation and the metric rules; the toggles are saved inlocalStorage. - Production design: WordPress with a PHP must-use plugin for dequeues, defer, preload and critical CSS; Nginx FastCGI cache (or the host's page cache); AVIF/WebP sub-sizes from core; measurement with PageSpeed Insights and WebPageTest, three runs per page.
Results#
- An interactive model with 11 fixes that shows each one's effect on the waterfall, the main thread and the estimated metrics.
- With everything off, the model estimates an LCP of about 19 seconds; with everything on, about 3.3 seconds. These are outputs of my model with the constants shown on the page, not measurements of any site.
- A PHP must-use plugin that applies the same fixes on a real install, readable in the demo's source.
This is a concept build; no real site or user was measured. The next step for real numbers is the measurement plan below.
Try the demo#
Open the speed simulator. Things to try:
- Turn on only Defer JavaScript: first paint moves earlier, TBT goes up. Look at the red parts of the main-thread row.
- Turn on Replace slider and Preload hero, and watch the starred hero row move to the left.
- Press after (all on), then turn off AVIF/WebP: LCP gets worse because the hero is bigger again.
What I would do next#
- Build the real before-and-after pair on two identical WordPress installs, measure with PageSpeed Insights and WebPageTest three times each, and publish the reports next to the model's estimates.
- Calibrate the model's constants against those measurements.
- Add a repeat-visit mode with browser caching and a service worker.